The Best and Worst U.S. States for Living with Cerebral Palsy
How does your state stack up when it comes to providing services to assist people with Cerebral Palsy as they seek a fulfilling, productive, healthy and independent life? A recent report from United Cerebral Palsy ranks each state according to a number of factors regarding how the jurisdictions serve residents with Cerebral Palsy.
The report, titled “The Case for Inclusion 2016” provides a snapshot assessment of how the states are doing when it comes to four key outcomes:


Analyzing data from multiple sources, theresearch team assigned rankings to each of the 50 states and the District of Columbia. According to the analysis, here is how they rank:
- Arizona
- Vermont
- New Hampshire
- Michigan
- Hawaii
- California
- District Of Columbia
- Missouri
- South Dakota
- Maryland
- Colorado
- Minnesota
- New York
- South Carolina
- Delaware
- Ohio
- Maine
- Oregon
- Kentucky
- Indiana
- Pennsylvania
- Alabama
- Georgia
- Utah
- Kansas
- Massachusetts
- Connecticut
- Washington
- Florida
- Alaska
- Wisconsin
- Louisiana
- West Virginia
- New Jersey
- Tennessee
- Rhode Island
- Nevada
- North Carolina
- Virginia
- New Mexico
- Nebraska
- Idaho
- Wyoming
- Oklahoma
- Iowa
- North Dakota
- Illinois
- Montana
- Arkansas
- Texas
- Mississippi
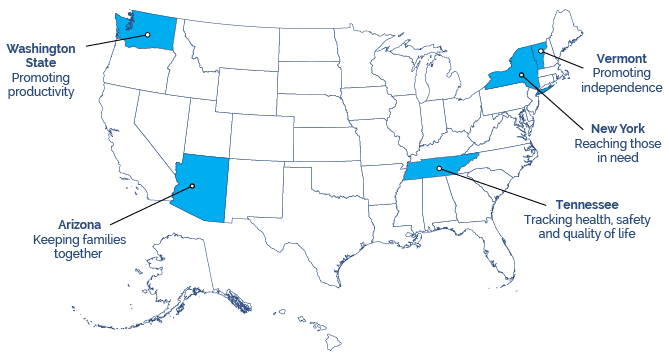
Highest-Ranking States by Category
Although they may not have been ranked at the top overall, some states outperformed all others in each of the five categories in the report. The top-ranking states by category were:

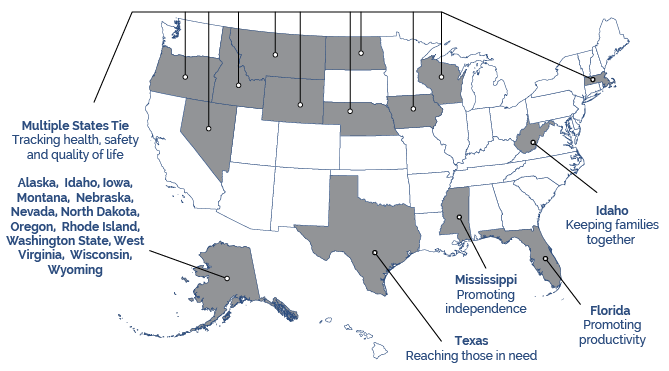
Lowest-Ranking States by Category
Other states performed particularly poorly in certain areas. The lowest-ranking states in each category were:


Factors Considered in Ranking the States
United Cerebral Palsy looked at a number of factors to calculate the rankings for the states. Some of the key metrics used in the study include:
- Types of housing for people with intellectual and developmental disabilities
- How many residents live in housing facilities (the fewer the better)
- Percentage of people with intellectual and developmental disabilities who live in large state institutions (the fewer the better)
- Percentage of people with intellectual and developmental disabilities who live in a family home (the more the better)
- Number of people with intellectual and developmental disabilities who report feeling lonely less than half the time
- Number of people with intellectual and developmental disabilities who had a recent dental appointment
- Number of people with intellectual and developmental disabilities who report not feeling scared in their home
- Number of people with intellectual and developmental disabilities who report having relationships with people other than staff and family
- Percentage of people with intellectual and developmental disabilities who are employed
- Vocational rehabilitation rate (number of participants who find a job)
- Number of hours worked per participant in vocational rehabilitation
- Number of participants in vocational rehabilitation who kept a job for at least a year
- Percentage of people with intellectual and developmental disabilities who receive home and community-based services
- Average growth of waiting list for residential and home and community-based services for people with intellectual and developmental disabilities
- Number of individuals with intellectual and developmental disabilities served per 100,000 population
DISCLAIMER: WHEN ‘FEWER THE BETTER’ IS USED, THIS MEANS MORE ATTENTION IS AVAILABLE AND PROBLEMS ASSOCIATED WITH OVER-CROWDING ARE NOT AS PREVALENT
Changes in Rankings
Since the organization began compiling the report in 2007, some states have made significant improvements, while others have fallen in the rankings. Here are some of the biggest movers during the past decade:

MOST IMPROVED
2007-2016
| 2016 Ranking | 2007 Ranking | Change | |
|---|---|---|---|
| 1. District of Columbia | 7th | 49th | 42 |
| 2. Missouri | 8th | 41th | 33 |
| 3. Ohio | 16th | 48th | 32 |
| 4. Maryland | 10th | 33rd | 23 |
| 5. Kentucky | 19th | 40th | 21 |
| 6. Indiana | 20th | 37th | 17 |
| 7. South Dakota | 9th | 26th | 17 |

GREATEST DECLINE
2007-2016
| 2016 Ranking | 2007 Ranking | Change | |
|---|---|---|---|
| 1. Idaho | 16th | 29th | -17 |
| 2. West Virginia | 39th | 25th | -17 |
| 3. Connecticut | 37th | 22th | -21 |
| 4. Massachusetts | 22nd | 6th | -22 |
| 5. Wyoming | 36th | 19th | -26 |
| 6. New Mexico | 38th | 18th | -27 |
| 7. Alaska | 23rd | 2nd | -28 |
| 8. Montana | 29th | 8th | -29 |
[videosingle id=”10492″ width=”95%” height=”400″ /]
For more information on Medical Legal Reviews and Lifetime Benefits, contact Stern Law, PLLC today by completing the form on this page or calling (800) 462-5772.


